Observability of a platform with Instana
Recently, I was investigating for a good APM solution. I came across many and tried only a few of them in the end. Instana was one of those solution that I wanted to go a bit deeper in my evaluation.
In this article, I will be using Azure Kubernetes Service (AKS) with a simple Dotnet core application. The Ingress controller is more or less the default one (Nginx Ingress Controller).
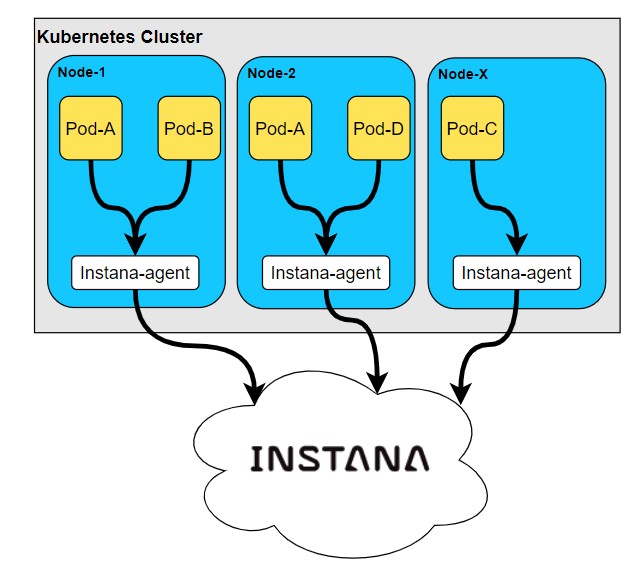
The flow below gives an overview of how everything gets pushed to Instana. Keep in mind that the instana-agent is also taking information from the infrastructure itself (Kubernetes, nodes, …) and do also some auto-discovery. The view below is quite simplified.
What is the meaning of APM?
APM stands for Application Performance Monitoring (or sometimes Management). Basically, it helps to understand how your platform is doing and help you investigates more deeply when an error occurs. This is a part of the observability of a platform.
If you wish to know more about observability, I suggest you to go read also the following articles:
- Logz.IO – What is observability
- M-Square – How to get the answers you deserve using the 3 pillars of observability
- XenonStack – What is observability
- Instana – Observability VS Monitoring
Installation of Instana
As I was going to use it with a Kubernetes Infrastructure, I decided to follow the step by step from the website. It worked great. That being said, you should probably use the Helm 3 chart instead in order to make it easier for integration and update of the system. I discovered the Helm chart a bit after I installed it using the generated YAML from the website. Keep in mind that the repository is actually in the “general” helm repository and will be moved within the Instana site repository.
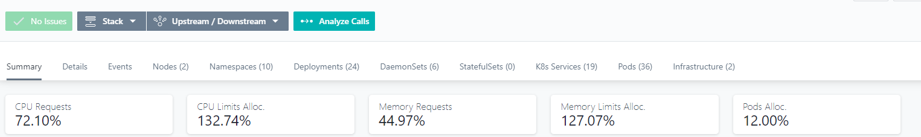
Once the installation completed, you will start seeing your entire infrastructure in Instana without having doing much. So the namespaces, pods, services, etc. will be displayed. In case you have a non dotnet service, you might as well be already seeing some details from your applications within the screens.
Deploying/Using a Dotnet application
Basically, to get the things working, you simply have to follow the documentation on the site (Instana Doc). Basically, instead of adding a package in your Dockerfile, you use a library. The idea is pretty much the same, but at least it’s more predictable and it’s a no brainer.
NuGet:
- Instana.Tracing.Core – Basic thing to add. This communicate with the agent on the infrastructure
- Instana.Tracing.Core.Sdk – If you want to create custom spans and better tracing
- Instana.Tracing.Core.Rewriter.Linux (Linux, not Alpine) – This is the package adding the tracing C library (.so) and creates a folder for some settings and all. Just use the default, it will work just fine. A different package exist for Alpine or other (see the doc.)
Probably, most people will use only the Core and the Rewriter in order to send the basic data. The SDK is if you wish to let’s say, add the CustomerId as part of information within the request tracing.
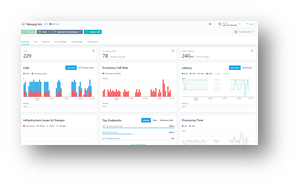
Once running, your dashboard will start receiving the requests:
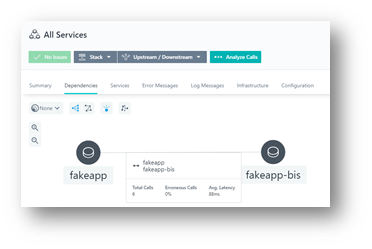
You can also easily see the communication from your service to other services by having an automatic-dependency graph (Below you can see my 2 services interaction, if you had a database, it would also show):
In Instana it’s also easy to see our performances metrics since they also show based on the services. You can also track the frontend application by adding a small snippet.
Instana also offer some automatic monitoring and generate alerts based on some metrics. Such alerts can be reconfigured. It can also send message to your MS Teams group/channel. Which mean, that you could even add some flow to your issues (Microsoft Flow/Power Automate).
Single agent per node
It’s important to note that we have 1 agent per node. So our application require to call our “actual” node agent in order to send the data. In Kubernetes you will probably have a deployment file with something similar to this:
        env:
        - name: INSTANA_AGENT_HOST
          valueFrom:
            fieldRef:
              fieldPath: status.hostIP
This is a different model than, let’s say, New-Relic. In New-Relic, we have 1 agent per host AND our containers (dotnet) will be also having an agent sending data directly to New-Relic.
Pricing model
The pricing model can be quite attractive for most company. In my case, it was not attractive enough since we would need agents on multiple nodes and server (on premise). If your infrastructure is well-known it will be easy to calculate the cost since it’s not based on the consumption of logs nor users. It is solely based on the number of hosts. So if you have a cluster of 5, you do 79$*5.
This mean that you won’t lose any logs and won’t be afraid to simply ship everything over there. That’s a big win if you compare to the complex pricing of DataDog.
Some UI bugs or improvement to be made at the moment of writing
(Bug) The “Live” update was not always working for me and I had to refresh the page. Maybe this was due to my browser, who knows. The refresh was also sometimes removing the live option and I had to push it back for some reason.
(Improvement) I was searching how to create a custom dashboard. The main dashboard is easy to find. It’s the first button in the menu on the left. However, once there, we need to click on the Instana button (top left) in order to see that we can create our own dashboard. I wish it was clearer to add a new dashboard. I must have skipped the welcome screen, so that’s why I didn’t notice at first.
Conclusion
Depending on your need, this solution could be a game changer in terms of pricing, observability and much more.