ChartJs with SonarQube API’s – Make your own reports
Recently asked to do reports every two weeks to all the teams about their good/bad behaviors and at the same time look if the guidelines were somewhat respected, I decided to build a dashboard using ChartJs and a connection to SonarQube via a local proxy built in Dotnet Core. That report is not built in order to hit the team or anything, it’s more in order to know our current situation and what we should improve. We can also relate the data from Jira (using the api’s) in order to know if we’re improving our bug ratio.
This article will only do a quick start using the template I’ve created recently in Dotnet Core. I won’t put too much details around the code since it’s quite straight forward.
Pre-requisites
- Dotnet core 2.1 (at the time of writing)
- NodeJs + NPM (>10 at the time of writing)
- Visual Studio Code OR Visual Studio Community/Professional
- A browser (Chrome, or anything else)
Install a quick start from a Dotnet Core template
As mentioned before, you will be using a quick start I created. I use it quite often, so there’s improvement in it happening regularly. So I suggest you to look for updates once in a while. It gives a front-end that could run without backend, and a backend in dotnet core 2.1 ready to serve API’s (including swagger).
> dotnet new -i HoNoSoFt.DotNet.Web.Spa.ProjectTemplates
Once installed, let’s create our template (vuejs-picnic-table):
> mkdir Sonar.Reports
> cd Sonar.Reports
> dotnet new vuejs-picnic-table
And to be sure it works, then let’s run at least in development mode.
> npm install
> dotnet run --environment="Development"
The installation of the NPM packages are needed most likely the first time due to the nature of the project. This could be automated, but would make the project takes a lot of time before even being able to start editing any files. (Personal choice here)
The result should look like the following screen (https://localhost:5001/) OR the demo page available here.
You might get an error the time Webpack generate the files. In that case, simply hit refresh (F5)

Once the application is running, keep it running while you edit your files (next step). You will simply have to hit F5 to refresh the changes.
Clean or add route to the template
Delete all the un-necessary things or simply add a new page. We’ll go here with the latter.
- Create the file: ./ClientApp/pages/sonar.vue
-
<template>
 <div>
   <page-title title="Sonar" />
 </div>
</template>

<script>
export default {

}
</script>
-
- Add the new route for the page in ./ClientApp/router/routes.js
- Add a import in the import section:
import Sonar from 'pages/sonar' - Add the route after about:
{ name: 'Sonar', path: '/:lang?/sonar', component: Sonar, display: 'Sonar', i18n: 'route.sonar', icon: 'icon-home', meta: { order: 6 } },
- Add a import in the import section:
- Add the translation/I18n for the new menu in ./ClientApp/_i18n/lang/en.js
- In the routes group under about, add:
sonar: 'Sonar'
- In the routes group under about, add:
- Save all this and hit F5 in the browser
Congratulation! You’ve created your first page in VueJs. Now it is the time to fill the data and before that, we need to create a service provider.
Access to Sonar Qube API’s from C#
Create your provider in C#, because if you’re not on the same server as your SonarQube, you might get some issue by only using the front-end. Here, we will be creating a simple proxy without any parameters. For those of you who didn’t know, the API is available at your SonarQube URL like the following: https://mySonarQube.url.com/api/.
Generate an API key for your user
- Go in your account (top right icon)
- Go under security
- Generate a new token (The name does not matters, but let’s name it: Sonar.Reports)
- Copy and paste the key somewhere you won’t loose. Otherwise you will have to re-generate the API token.
Open your project in VS Code or Visual studio
If you’re lucky enough, you will have a Properties folder, otherwise you will have to create it and add the file launchSettings.json
{
  "$schema": "http://json.schemastore.org/launchsettings.json",
  "iisSettings": {
    "windowsAuthentication": false,
    "anonymousAuthentication": true,
    "iisExpress": {
      "applicationUrl": "http://localhost:21535",
      "sslPort": 44307
    }
  },
  "profiles": {
    "IIS Express": {
      "commandName": "IISExpress",
      "launchBrowser": true,
      "launchUrl": "api/values",
      "environmentVariables": {
        "ASPNETCORE_ENVIRONMENT": "Development"
      }
    },
    "Sonar.Reports": {
      "commandName": "Project",
      "launchBrowser": true,
      "launchUrl": "api/values",
      "applicationUrl": "https://localhost:5001;http://localhost:5000",
      "environmentVariables": {
        "ASPNETCORE_ENVIRONMENT": "Development"
      }
    }
  }
}
Update your ./Startup.cs and add a new Service configuration:
public void ConfigureServices(IServiceCollection services){
  // ...
  services.AddHttpClient();
  // ...
}
Create the file ./Controllers/SonarController.cs and add the following code:
using System;
using System.Collections.Generic;
using System.ComponentModel.DataAnnotations;
using System.Net.Http;
using System.Text;
using System.Threading.Tasks;
using Microsoft.AspNetCore.Mvc;

namespace Sonar.Reports.Controllers
{
    [Route("api/[controller]")]
    [ApiController]
    public class SonarController : ControllerBase
    {
        private HttpClient _sonarHttpClient;

        public SonarController(IHttpClientFactory httpClientFactory){
          _sonarHttpClient = httpClientFactory.CreateClient("sonar");
          _sonarHttpClient.BaseAddress = new Uri("https://sonar.yourSonarQube.com/api/");
          var basicToken = Convert.ToBase64String(Encoding.UTF8.GetBytes("f6d6fecfdcd7836612a0fef4a3f307b7725f8387:"));
          _sonarHttpClient.DefaultRequestHeaders.Authorization = new System.Net.Http.Headers.AuthenticationHeaderValue("Basic", basicToken);
        }

        /// <summary>
        /// GET Sonar data
        /// </summary>
        /// <returns>Returns an enumerable of value</returns>
        [ProducesResponseType((int)System.Net.HttpStatusCode.OK)]
        [HttpGet]
        public async Task<IActionResult> Get()
        {
            var result = await _sonarHttpClient.GetAsync("measures/search_history?component=yourComponentName&metrics=bugs%2Ccode_smells%2Cvulnerabilities%2Creliability_rating%2Csecurity_rating%2Csqale_rating&ps=1000");

            // Not perfect but it will do for the sample.
            return Content(await result.Content.ReadAsStringAsync());
        }
    }
}
Where:
- www.yourSonarQube.com is your address of your Sonar Qube
- The token you’ve created earlier replaces f6d6fecfdcd7836612a0fef4a3f307b7725f8387 (Don’t forget to keep the “:”, it is mandatory in a basic authentication, where it’s usually user:password in Base 64)
- yourComponentName is replaced by your real component name in Sonar Qube (To get it, open sonar qube, go in your project you want to test, and then take the value from the URL. It’s always there.)
Now, restart your application (Ctrl+C and then re-type dotnet run, if you’re in console mode).
You can test the endpoint by going to http://localhost:5001/swagger/ and use the swagger UI in order to test it. If you have errors, you will see it in your console (or output in Visual Studio).
Add the ChartJS to your project
Go in your root folder where your project is located (csproj) and then type the following command in order to install Chart.Js:
> npm install chart.js --save
Now that you have installed this new dependency, you can add the Chart.Js within your VueJs application.
Edit your ./ClientApp/pages/sonar.vue and add a default Chart.Js available through all their demo on their site. Here, I will be using the line API
<template>
  <div>
    <page-title title="Sonar" />

    <canvas ref="chart" id="canvas"></canvas>
  </div>
</template>

<script>
// Import ChartJS
import Chart from 'chart.js'

// Colors
var chartColors = [
  'rgb(255, 99, 132)',
  'rgb(255, 159, 64)',
  'rgb(255, 205, 86)',
  'rgb(75, 192, 192)',
  'rgb(54, 162, 235)',
  'rgb(153, 102, 255)',
  'rgb(201, 203, 207)'
]

export default {
  data () {
    return {
      chart: null,
      chartConfig: {
        type: 'line',
        data: {
          labels: [],
          datasets: []
        },
        options: {
          responsive: true,
          title: {
            display: true,
            text: 'Enjoy your Chart.Js with Sonar'
          },
          tooltips: {
            mode: 'index',
            intersect: false,
          },
          hover: {
            mode: 'nearest',
            intersect: true
          },
          scales: {
            xAxes: [{
              display: true,
              type: 'time',
              scaleLabel: {
                display: true,
                labelString: 'Date'
              }
            }],
            yAxes: [{
              display: true,
              scaleLabel: {
                display: true,
                labelString: 'Value'
              }
            }]
          }
        }
      }
    }
  },

  mounted () {
    this.chart = new Chart(this.$refs.chart, this.chartConfig)
    this._loadSonarData()
  },

  methods: {
    _loadSonarData: async function () {
      let response = await this.$http.get(`./api/sonar`)
      var sonarData = response.data

      // We now have measures + data
      var measures = sonarData.measures
      let allLabels = []
      for (var m = 0; m < measures.length; m++) {
        let currentColor = chartColors[m % chartColors.length]
        var data = {
          label: measures[m].metric,
          backgroundColor: currentColor,
          borderColor: currentColor,
          tension: 0, // If you don't want bezier curves
          data: [],
          fill: false,
        }

        for (var h = 0; h < measures[m].history.length; h++) {
          let date = new Date(measures[m].history[h].date)
          if (allLabels.indexOf(date) < 0) {
            allLabels.push(date)
          }

          data.data.push(measures[m].history[h].value)
        }

        this.chartConfig.data.datasets.push(data)
      }

      this.chartConfig.data.labels = allLabels
      this.chart.update()
    }
  }
}
</script>
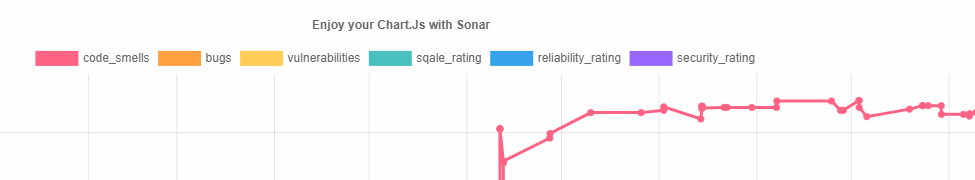
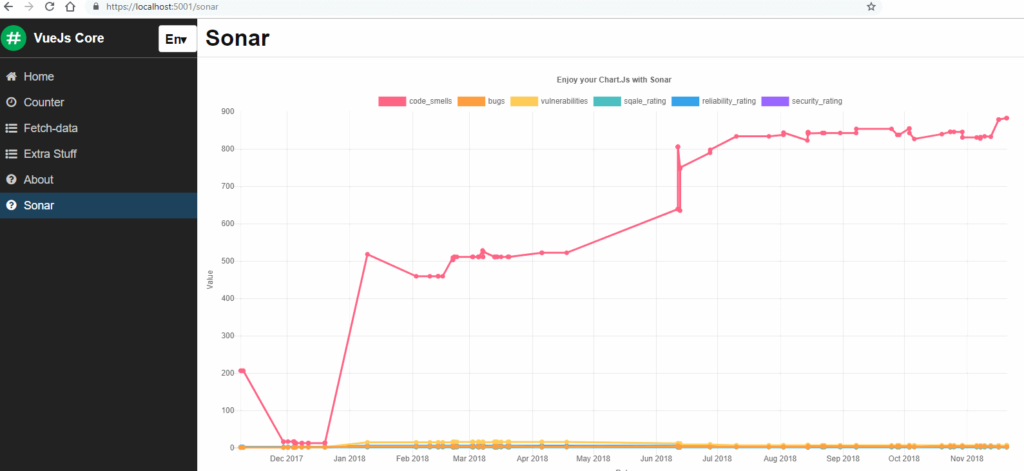
Results
If you’ve followed and didn’t make any big mistakes, the result should looks somewhat like the following
Next step?
Basically, yes, there’s a next step. Since you have been able to call the Sonar Qube Api’s, you now know that you can also configure all the requests to it. For example, you could say “I want data for the last 30 days” or in my case, for the last 3 sprints and then draw vertical lines (using a plugin) in order to show exactly where are the sprint and how it went (For example: rush at the end or not).
You could also add a dropdown at the top, or different menu or customization for other projects/stats you’d like to have.
Since you’re using the canvas, don’t forget you could also make a download or extract image using JavaScript. In a way, you could auto-generate a Powerpoint or word document, or other since you have all the data required to do so.
Conclusion
I hope you’ve enjoyed this post.